 I recently needed to share some network utilization data with some non IT folks in our organization. I produced a quick report from a dynamic HTML page that contained multiple MRTG graphs. Needless to say the graphs did most of the talking while I just answered the questions. One person commented that they didn’t know we had purchased such an elaborate management and monitoring solution. In short we hadn’t purchased any high-end management or monitoring solution, but we had setup Multi Router Traffic Grapher (MRTG) and Round Robin Database (RRD) both of which were written by Tobi Oetiker with contributions from many others.
I’ve been personally using MRTG for well over 10 years now and I’ve yet to find any product (commercial or open source) that comes close. These two tools work hand in hand to help me graph and chart almost any SNMP value (you can also graph non-SNMP values but you need a script or something to collect the values) on almost any device connected to the network. The obvious examples for network engineers and architects such as myself is to use MRTG/RRD to help monitor current network utilization and forecast future growth. There are other examples such as graphing the temperature of a computer room or even the amount of rainfall. There are literally hundreds of examples but I’ll leave you to enjoy reading about them all from the MRTG web site.
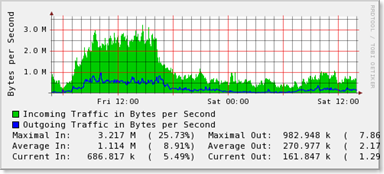
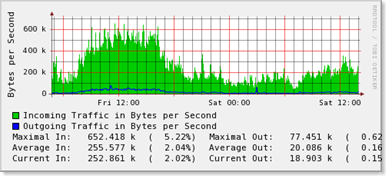
Here are two quick examples;
Internet Link with XO (Ethernet ~ 50Mbps)

Internet Link with Level3 (Ethernet ~ 50Mbps)

In the above figures MRTG is graphing the average of ifInOctets and ifOutOctects over a 5 minute interval. As I said above you could graph almost any value you wished.
I also use MRTS by Thor Dreier to help get an idea of how much actually data is traversing a specific network or interface. When we recently installed an HP MAS (Medical Archive Solution) which was built around grid computing and virtual storage technologies we observed a 300% increase in WAN traffic as the MAS was replicating data for business continuity purposes.
I will admit that MRTG can be somewhat complicated for the fledgling network engineer. However, there are dozens of implementation guides now available on the MRTG web site, including support for running MRTG on Windows.
Cheers!
Hi,
Both tools are really great and amazing! You should try Cacti tool too, this is a very good graphing solution.By the time, Is it possible to monitor ES460/470 CPU utilization?! Pls, Could you share these scripts you mention ?
Hello,
I’ve tried Cacti and it’s a very nice tool but too big for me. I like having the ability to embed dynamic images in my HTML documents. This allows me to place utilization graphs inside almost any Content Management System without it knowing anything about MRTG/RRD.
With respect to the ES 470 switch. There really isn’t any CPU counter to monitor. Nortel products aren’t usually CPU bound like Cisco products can be although there are exceptions to that rule. You could graph the CPU and Switch Fabric utilization of an ERS 8600 if you choose so long as you know the SNMP MIB OIDs (they are in the Rapid City MIB if you are looking for them).
I’m currently using 14all.cgi to produce my simple network utilization graphs. In future posts I hope to highlight some of the more interesting things that MRTG/RRD can graph, providing examples of course!
Cheers!