Here’s an old story that I never published.. and seeing that I haven’t been writing much lately I’m going to take the easy route and just publish this.
It’s been another interesting weekend… and by interesting I actually mean another weekend of working through yet another challenging issue.
Summary
It started back on Thursday with more than a few alerts from my own custom built monitoring solution. A few years back I wrote a Bash script to help monitor the Internet facing infrastructure and numerous VIPs that we host in our Data Centers. That script has worked well over the years helping validate application availability against network availability. With everything else going on I purposely ignored the alerts, assuming there was some DoS attack or other malady that the Internet was suffering from and it would soon fix itself. By late Friday afternoon I could no longer ignore the alerts as they were pilling up in my Inbox by the hundreds and it was long past time to roll up the sleeves and figure out what had broken where. I initially assumed that I would find some issue or problem with either the hosting company or an Internet Service Provider. A cursory review of the Internet border routers revealed that a few 10Gbps Internet links had bounced within the past 30 days but everything was running clean from the Internet Service Provider through our border routers, switches and firewalls up to our Internet facing load balancers. Initially I thought there was an issue with either AT&T or NTT as a number of the monitoring servers were traversing those ISPs but after a number of tests I found that packet loss across either of those ISPs was generally less than 0.4% which isn’t all that bad. If the plumbing was looking good then why were the alerts firing? I looked at the alert again and noticed that the messages read “socket timeout” and not “socket connection failure”.
In any event I ran a quick packet trace using tcpdump from one of the monitoring servers and found that there was traffic flowing, although there was a significant amount of retransmissions and missing packets. It looked like the health checks were timing out at the default of 10 seconds. I increased the timeout to 20 seconds and bingo the majority of health checks were now returning successfully. I’m not sure I agree with the verbiage of “socket timeout” since the socket was exchanging information between the client and server, it was more of an overall application timeout since the request was not completed with the specified timeout value.
Data Analysis
Now the $1,000,000 question, what had changed that I needed to increase the timeout?
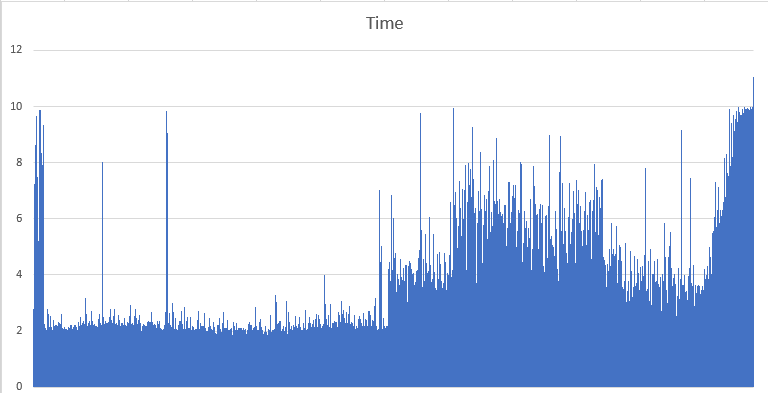
Thankfully I’ve been logging this data for the past 3+ years so I was able to import of a few of the data points since Sept 2017 (207K rows – 1 every 60 seconds) into Excel and using the quick chart shortcut (Alt-F1) I was able to quickly visualize the data which provided some interesting results. The amount of time it was taking the health checks to complete had risen significantly in the past few weeks.
With that data it was now clear that the health checks were failing because they were hitting the 10 second default timeout. But what had happened that it was now taking on average longer than 10 seconds for the backend to return the result to the client? Was the backend slower to respond that it had previously been? Was the Internet slower than it had previously been? Was there enough packet loss and retransmissions to impact the timing? Was the size of the data being returned changing?
In short the answer appears to be a little bit of everything above.
- Was the backend slower to respond that it had previously been? Yes
- Was the Internet slower than it had previously been? Yes (I always assuming the Internet is getting more and more congested)
- Was there enough packet loss and retransmissions to impact the timing? Yes (especially with 3K+ miles between the endpoints)
- Was the size of the data being returned changing? Yes (the size of the HTML was increased causing more data to be transferred)
An interesting but logical side affect, the monitoring servers that were the farthest from the Data Center in question had a greater number of errors. This is logical because they would have the greater latency to reach that specific Data Center, any packet loss or retransmissions would cause additional delay given the latency. This explains why some monitoring servers were reporting no issues or problems and others were reporting all sorts of issues and problems. The increased physical distance between the Data Center and the monitoring server was exacerbating the timing because of the inherit packet loss and retransmissions on the Internet which was further exacerbated by the growing size of the HTML that was being transferred across those vast distances and increased time it was taking the backend to ultimately serve up the response.
This is a great example of why you can’t always just blame the network, even though it’s the easiest thing to do.
Resolution
In the end I found a failing 10Gbps SFP in the Internet facing load-balancers that needed to be replaced. I placed a monitoring probe on the local network and found the same amount of packet loss and re-transmissions which confirmed that the problem was local to my Data Center. I failed over between the primary and secondary Internet facing load-balancers and the problem disappeared so the issue was with the primary Internet facing load-balancer.
Cheers!


