 In the first part of this two post series I gave you a small sample of some CLI diagnostic commands that are available in the Succession Signaling Server v4.5. In this post I’m going to get a little more detailed and focus on some very specific commands used for troubleshooting voice quality in a VoIP network.
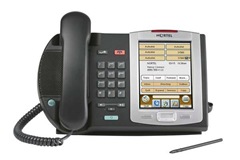
For the purpose of this post we’ll assume that we’re using and i2004 (Phase 2) phone. These commands are available on i2002,i2004, and i2007 (Phase 2 phones only). And also available on the 1120e/1140e and 1150e (they might be available on the i2050 softphone).
With the phone online you can remotely command the phone to perform a number of basic network troubleshooting commands as well as retrieve detailed network statistics. From the CLI interface of the Succession Signaling Server you can issue the following commands;
rPing <TN | IP>, <dest>[,<count>]
This command will instruct the phone to ping an IP address.
oam> rPing 10.1.198.50, 10.1.240.40, 5
27/05/2008 18:16:34 LOG0006 VTM:rPing Report from set (10.1.198.50)
64 bytes packets received from IP 10.1.240.40
27/05/2008 18:16:34 LOG0006 VTM:rPing Report from set (10.1.198.50)
ICMP sequence is 0
27/05/2008 18:16:34 LOG0006 VTM:rPing Report from set (10.1.198.50)
round trip time in ms: 20
27/05/2008 18:16:35 LOG0006 VTM:rPing Report from set (10.1.198.50)
64 bytes packets received from IP 10.1.240.40
27/05/2008 18:16:35 LOG0006 VTM:rPing Report from set (10.1.198.50)
ICMP sequence is 1
27/05/2008 18:16:35 LOG0006 VTM:rPing Report from set (10.1.198.50)
round trip time in ms: 20
27/05/2008 18:16:36 LOG0006 VTM:rPing Report from set (10.1.198.50)
64 bytes packets received from IP 10.1.240.40
27/05/2008 18:16:36 LOG0006 VTM:rPing Report from set (10.1.198.50)
ICMP sequence is 2
27/05/2008 18:16:36 LOG0006 VTM:rPing Report from set (10.1.198.50)
round trip time in ms: 20
27/05/2008 18:16:37 LOG0006 VTM:rPing Report from set (10.1.198.50)
64 bytes packets received from IP 10.1.240.40
27/05/2008 18:16:37 LOG0006 VTM:rPing Report from set (10.1.198.50)
ICMP sequence is 3
27/05/2008 18:16:37 LOG0006 VTM:rPing Report from set (10.1.198.50)
round trip time in ms: 20
27/05/2008 18:16:38 LOG0006 VTM:rPing Report from set (10.1.198.50)
64 bytes packets received from IP 10.1.240.40
27/05/2008 18:16:38 LOG0006 VTM:rPing Report from set (10.1.198.50)
ICMP sequence is 4
27/05/2008 18:16:38 LOG0006 VTM:rPing Report from set (10.1.198.50)
round trip time in ms: 20
27/05/2008 18:16:38 LOG0006 VTM:rPing Report from set (10.1.198.50)
64 bytes packets received from IP 10.1.240.40
27/05/2008 18:16:38 LOG0006 VTM:rPing Report from set (10.1.198.50)
5 packets transmitted 5 packets received, 0 packets lost
27/05/2008 18:16:38 LOG0006 VTM:rPing Report from set (10.1.198.50)
minimum round trip time in ms: 20
27/05/2008 18:16:38 LOG0006 VTM:rPing Report from set (10.1.198.50)
average round trip time in ms: 20
27/05/2008 18:16:38 LOG0006 VTM:rPing Report from set (10.1.198.50)
maximum round trip time in ms: 20
oam>
rPingStop <TN | IP>
This command will instruct the phone to stop pinging.
rTraceRoute <TN | IP>, <dest>, <count>
This command will instruct the phone to trace the route of the destination address.
oam> rTraceRoute 10.1.198.50, 10.1.240.40, 3
27/05/2008 18:22:56 LOG0006 VTM: rTraceRoute Report from set (10.1.198.50):
1 -- 10.1.198.1: 0ms  0ms  0ms
27/05/2008 18:22:56 LOG0006 VTM: rTraceRoute Report from set (10.1.198.50):
2 -- 10.1.144.40: 20ms  20ms  20ms
27/05/2008 18:22:56 LOG0006 VTM: rTraceRoute Report from set (10.1.198.50):
3 -- 10.1.144.8: 20ms  20ms  20ms
27/05/2008 18:22:56 LOG0006 VTM: rTraceRoute Report from set (10.1.198.50):
rTraceRoute completed !
oam>
rTraceRouteStop <TN | IP>
This command will instruct the phone to stop the trace route.
RUDPStatShow <TN |IP>[, <clear>]
This command will display the RUDP statistics from the phone.
oam> RUDPStatShow 10.1.198.50
27/05/2008 18:27:19 LOG0006 VTM:RUDPStatShow Report from set (10.1.198.50)
Number of Message Sent: 451
27/05/2008 18:27:19 LOG0006 VTM:RUDPStatShow Report from set (10.1.198.50)
Number of Message Received: 153149
27/05/2008 18:27:19 LOG0006 VTM:RUDPStatShow Report from set (10.1.198.50)
Number of Retries: 1
27/05/2008 18:27:19 LOG0006 VTM:RUDPStatShow Report from set (10.1.198.50)
Number of Resets: 0
27/05/2008 18:27:19 LOG0006 VTM:RUDPStatShow Report from set (10.1.198.50)
Uptime of Current TPS Registration: 0days 4hours 19minutes 8seconds
You can also append a value of 1 to the previous query to clear the statistics;
oam> RUDPStatShow 10.1.198.50, 1
RUDPStatShow: clear statistics after RUDPStatShow
27/05/2008 18:29:04 LOG0006 VTM:RUDPStatShow Report from set (10.1.198.50)
Number of Message Sent: 0
27/05/2008 18:29:04 LOG0006 VTM:RUDPStatShow Report from set (10.1.198.50)
Number of Message Received: 0
27/05/2008 18:29:04 LOG0006 VTM:RUDPStatShow Report from set (10.1.198.50)
Number of Retries: 0
27/05/2008 18:29:04 LOG0006 VTM:RUDPStatShow Report from set (10.1.198.50)
Number of Resets: 0
27/05/2008 18:29:04 LOG0006 VTM:RUDPStatShow Report from set (10.1.198.50)
Uptime of Current TPS Registration: 0days 4hours 20minutes 53seconds
eStatShow <TN | IP> [, <clear]
This command will display the Ethernet statistics from the phone.
oam> eStatShow 10.1.198.50
27/05/2008 18:30:55 LOG0006 VTM:eStatShow Report from set (10.1.198.50)
Duplex Mode: 1
27/05/2008 18:30:55 LOG0006 VTM:eStatShow Report from set (10.1.198.50)
Auto Negotiate Protocol Received: 0x3
27/05/2008 18:30:55 LOG0006 VTM:eStatShow Report from set (10.1.198.50)
Interface Speed: 1
27/05/2008 18:30:55 LOG0006 VTM:eStatShow Report from set (10.1.198.50)
LAN Priority Bit: 0
27/05/2008 18:30:55 LOG0006 VTM:eStatShow Report from set (10.1.198.50)
VLAN ID: 1
27/05/2008 18:30:55 LOG0006 VTM:eStatShow Report from set (10.1.198.50)
Packet Collision Peg Count: 0
27/05/2008 18:30:55 LOG0006 VTM:eStatShow Report from set (10.1.198.50)
CRC Error Peg Count: 0
27/05/2008 18:30:55 LOG0006 VTM:eStatShow Report from set (10.1.198.50)
Frame Error Peg Count: 0
As with the RUDPStatShow command you append a value of 1 to the query to clear the Ethernet statistics. I’ll skip the example but the command would be “eStatShow 10.1.198.50, 1”.
isetInfoShow <TN | IP>
This command will display the phone configuration and server information.
oam> isetInfoShow 10.1.198.50
27/05/2008 18:36:34 LOG0006 VTM:isetInfoShow Report (DHCPConfig) from Set (10.1.198.50)
Terminal Type: i2002 Ph2
27/05/2008 18:36:34 LOG0006 VTM:isetInfoShow Report (DHCPConfig) from Set (10.1.198.50)
Firmware Version: 0604DBG
27/05/2008 18:36:34 LOG0006 VTM:isetInfoShow Report (DHCPConfig) from Set (10.1.198.50)
Hardware ID: 18-001765ffe0fc-6602
27/05/2008 18:36:34 LOG0006 VTM:isetInfoShow Report from Set (10.1.198.50)
Firmware ID: 0x02
27/05/2008 18:36:34 LOG0006 VTM:isetInfoShow Report from Set (10.1.198.50)
Manufacture Code: 0x001765
27/05/2008 18:36:34 LOG0006 VTM:isetInfoShow Report from Set (10.1.198.50)
Color Code: 0x66
27/05/2008 18:36:34 LOG0006 VTM:isetInfoShow Report from Set (10.1.198.50)
PEC Code: NTDU91AA
27/05/2008 18:36:34 LOG0006 VTM:isetInfoShow Report from Set (10.1.198.50)
DHCP Server IP: 10.1.198.10
27/05/2008 18:36:34 LOG0006 VTM:isetInfoShow Report from Set (10.1.198.50)
VLAN Priority: 6
27/05/2008 18:36:34 LOG0006 VTM:isetInfoShow Report from Set (10.1.198.50)
VLAN ID: 14
27/05/2008 18:36:34 LOG0006 VTM:isetInfoShow Report from Set (10.1.198.50)
Set IP Address: 10.1.198.50
27/05/2008 18:36:34 LOG0006 VTM:isetInfoShow Report from Set (10.1.198.50)
Set Subnet Mask: 255.255.255.0
27/05/2008 18:36:34 LOG0006 VTM:isetInfoShow Report from Set (10.1.198.50)
Set IP Gateway Address: 10.1.198.1
27/05/2008 18:36:34 LOG0006 VTM:isetInfoShow Report from Set (10.1.198.50)
Boot Mode: 47
27/05/2008 18:36:34 LOG0006 VTM:isetInfoShow Report(Server Info) from Set (10.1.198.50)
Server 1
27/05/2008 18:36:34 LOG0006 VTM:isetInfoShow Report(Server Info) from Set (10.1.198.50)
Server IP = 10.1.240.40
27/05/2008 18:36:34 LOG0006 VTM:isetInfoShow Report(Server Info) from Set (10.1.198.50)
Port Number = 4100
27/05/2008 18:36:34 LOG0006 VTM:isetInfoShow Report(Server Info) from Set (10.1.198.50)
Action = 1
27/05/2008 18:36:34 LOG0006 VTM:isetInfoShow Report(Server Info) from Set (10.1.198.50)
Retry = 5
27/05/2008 18:36:34 LOG0006 VTM:isetInfoShow Report(Server Info) from Set (10.1.198.50)
Server 2
27/05/2008 18:36:34 LOG0006 VTM:isetInfoShow Report(Server Info) from Set (10.1.198.50)
Server IP = 10.1.240.40
27/05/2008 18:36:34 LOG0006 VTM:isetInfoShow Report(Server Info) from Set (10.1.198.50)
Port Number = 4100
27/05/2008 18:36:34 LOG0006 VTM:isetInfoShow Report(Server Info) from Set (10.1.198.50)
Action = 1
27/05/2008 18:36:34 LOG0006 VTM:isetInfoShow Report(Server Info) from Set (10.1.198.50)
Retry = 5
27/05/2008 18:36:34 LOG0006 VTM:isetInfoShow Report(Server Info) from Set (10.1.198.50)
Server 3
27/05/2008 18:36:34 LOG0006 VTM:isetInfoShow Report(Server Info) from Set (10.1.198.50)
Server IP = 0.0.0.0
27/05/2008 18:36:34 LOG0006 VTM:isetInfoShow Report(Server Info) from Set (10.1.198.50)
Port Number = 0
27/05/2008 18:36:34 LOG0006 VTM:isetInfoShow Report(Server Info) from Set (10.1.198.50)
Action = 1
27/05/2008 18:36:34 LOG0006 VTM:isetInfoShow Report(Server Info) from Set (10.1.198.50)
Retry = 0
RTPStatShow <TN | IP>
This command will display network metrics and QoS values.
NOTE: You’ll need to be in PDT to execute this command from the CLI interface of the Succession Signaling Server. In order to enter PDT simply hold down the <CTRL> while typing the letters “PDT”.
pdt> RTPStatShow 10.1.198.50
27/05/2008 18:42:10 LOG0006 shell: RTPStatShow: IP 10.1.198.50 is not an active set, displays the statistics from previous call
27/05/2008 18:42:10 LOG0006 VTM:RTPStatShow Report (RTCP-XR) from Set (10.1.198.50)
Far End IP address: 10.1.240.45
27/05/2008 18:42:10 LOG0006 VTM:RTPStatShow Report (RTCP-XR) from Set (10.1.198.50)
Far End Port: 5224
27/05/2008 18:42:10 LOG0006 VTM:RTPStatShow Report (RTCP-XR) from Set (10.1.198.50)
Local Packet Sent: 57
27/05/2008 18:42:10 LOG0006 VTM:RTPStatShow Report (RTCP-XR) from Set (10.1.198.50)
Local Packet Received: 0
27/05/2008 18:42:10 LOG0006 VTM:RTPStatShow Report (RTCP-XR) from Set (10.1.198.50)
Local Packet Received out of order : 0
27/05/2008 18:42:10 LOG0006 VTM:RTPStatShow Report (RTCP-XR) from Set (10.1.198.50)
Local Pkt Loss: 0%
27/05/2008 18:42:10 LOG0006 VTM:RTPStatShow Report (RTCP-XR) from Set (10.1.198.50)
Local Average Jitter: 0ms
27/05/2008 18:42:10 LOG0006 VTM:RTPStatShow Report (RTCP-XR) from Set (10.1.198.50)
Local Latency: 0ms
27/05/2008 18:42:10 LOG0006 VTM:RTPStatShow Report (RTCP-XR) from Set (10.1.198.50)
Local Listening R: 93
27/05/2008 18:42:10 LOG0006 VTM:RTPStatShow Report (RTCP-XR) from Set (10.1.198.50)
Vocoder Type: 0
27/05/2008 18:42:10 LOG0006 VTM:RTPStatShow Report (RTCP-XR) from Set (10.1.198.50)
Local Avg Net Loss Rate: 0.00%
27/05/2008 18:42:10 LOG0006 VTM:RTPStatShow Report (RTCP-XR) from Set (10.1.198.50)
Local Avg Discard Rate: 0.00%
27/05/2008 18:42:10 LOG0006 VTM:RTPStatShow Report (RTCP-XR) from Set (10.1.198.50)
Local Avg Burst Density: 0.00%
27/05/2008 18:42:10 LOG0006 VTM:RTPStatShow Report (RTCP-XR) from Set (10.1.198.50)
Local Avg Burst Length: 0ms
27/05/2008 18:42:10 LOG0006 VTM:RTPStatShow Report (RTCP-XR) from Set (10.1.198.50)
Local Gap Density: 0.00%
27/05/2008 18:42:10 LOG0006 VTM:RTPStatShow Report (RTCP-XR) from Set (10.1.198.50)
Local Gap Length: 0ms
27/05/2008 18:42:10 LOG0006 VTM:RTPStatShow Report (RTCP-XR) from Set (10.1.198.50)
Local Avg End System Delay: 5ms
27/05/2008 18:42:10 LOG0006 VTM:RTPStatShow Report (RTCP-XR) from Set (10.1.198.50)
Local Avg Noise Level: 0dBm
27/05/2008 18:42:10 LOG0006 VTM:RTPStatShow Report (RTCP-XR) from Set (10.1.198.50)
Local Avg Signal Power: 0dBm
27/05/2008 18:42:10 LOG0006 VTM:RTPStatShow Report (RTCP-XR) from Set (10.1.198.50)
Local Round Trip Time Avg: 0ms
27/05/2008 18:42:10 LOG0006 VTM:RTPStatShow Report (RTCP-XR) from Set (10.1.198.50)
Local Round Trip Time Avg High: 0ms
27/05/2008 18:42:10 LOG0006 VTM:RTPStatShow Report (RTCP-XR) from Set (10.1.198.50)
Remote Listening R: 0
27/05/2008 18:42:10 LOG0006 VTM:RTPStatShow Report (RTCP-XR) from Set (10.1.198.50)
Remote Avg Net Loss Rate: 0.00%
27/05/2008 18:42:10 LOG0006 VTM:RTPStatShow Report (RTCP-XR) from Set (10.1.198.50)
Remote Avg Discard Rate: 0.00%
27/05/2008 18:42:10 LOG0006 VTM:RTPStatShow Report (RTCP-XR) from Set (10.1.198.50)
Remote Avg Burst Density: 0.00%
27/05/2008 18:42:10 LOG0006 VTM:RTPStatShow Report (RTCP-XR) from Set (10.1.198.50)
Remote Avg Burst Length: 0ms
27/05/2008 18:42:10 LOG0006 VTM:RTPStatShow Report (RTCP-XR) from Set (10.1.198.50)
Remote Gap Density: 0.00%
27/05/2008 18:42:10 LOG0006 VTM:RTPStatShow Report (RTCP-XR) from Set (10.1.198.50)
Remote Gap Length: 0ms
27/05/2008 18:42:10 LOG0006 VTM:RTPStatShow Report (RTCP-XR) from Set (10.1.198.50)
Remote Avg End System Delay: 0ms
27/05/2008 18:42:10 LOG0006 VTM:RTPStatShow Report (RTCP-XR) from Set (10.1.198.50)
Remote Avg Noise Level: 0dBm
27/05/2008 18:42:10 LOG0006 VTM:RTPStatShow Report (RTCP-XR) from Set (10.1.198.50)
Remote Avg Signal Power: 0dBm
27/05/2008 18:42:10 LOG0006 VTM:RTPStatShow Report (RTCP-XR) from Set (10.1.198.50)
Remote Round Trip Time Avg: 0ms
27/05/2008 18:42:10 LOG0006 VTM:RTPStatShow Report (RTCP-XR) from Set (10.1.198.50)
Remote Round Trip Time Avg High: 0ms
27/05/2008 18:42:10 LOG0006 VTM:RTPStatShow Report (RTCP-XR) from Set (10.1.198.50)
Remote Packet Loss: 0%
27/05/2008 18:42:10 LOG0006 VTM:RTPStatShow Report (RTCP-XR) from Set (10.1.198.50)
Remote Average Jitter: 0ms
27/05/2008 18:42:10 LOG0006 VTM:RTPStatShow Report (RTCP-XR) from Set (10.1.198.50)
Remote Latency: 0ms
Well by now you’re probably asking yourself what does all this mean. Well hopefully you aren’t completely lost. The first few commands are used to test basic connectivity, rPing and rTraceRoute. You would use these commands to make sure that an IP phone could communicate with a VGMC (Voice Gateway Media Card) or perhaps even another IP phone. Once you know you have basic network connectivity then you might need to look at some of the network statistics. Perhaps there is an auto-negotiation issue or perhaps there is too much packet loss leading too poor voice quality.
Note: did you know that you can perform pings an trace routes from the phone itself? After the phone has successfully booted and is connecting to the Nortel Call Server just press the “Services” key twice and select “Network Diagnostic Tools”.
Cheers!


