 We ran into an interesting problem today with one or our Internet links.
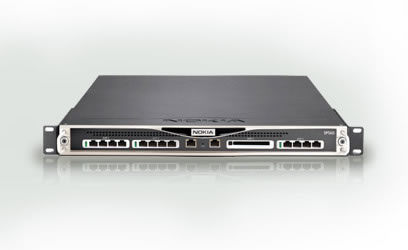
The Internet Service Provider for this (1Gbps) link is AboveNet and the circuit itself is terminated by a Cisco 7301 and then ultimately a pair of Check Point IP560 IPSO v6.2 Security Appliances (firewalls) running Check Point FireWall-1 NGX R70 utilizing VRRP clustering.
These two IP560s were only installed just recently and only went live two weeks ago so we’re still in the process of working out some of the bugs and refining the security policies. It didn’t take too long to realize that the primary IP560 firewall had 24,900 connections open and that we were hitting the default limit of 25,000 connections.
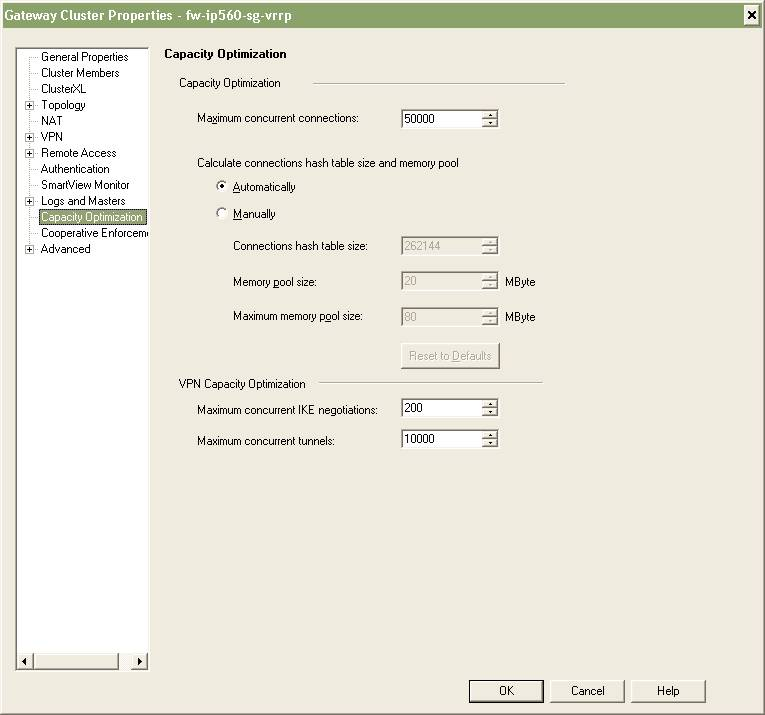
The obvious fix was to increase the value beyond 25,000. You need to be careful here and take into consideration the amount of memory you physically have available on your security gateway (firewall). I choose 50,000 as a starting point since our IP560s have 2GB of memory installed. I was able to increase the value by editing the Maximum concurrent connections value (Smart Dashboard -> Gateway Cluster Properties -> Capacity Optimization). We also had to push the policy to the cluster before the change took affect.
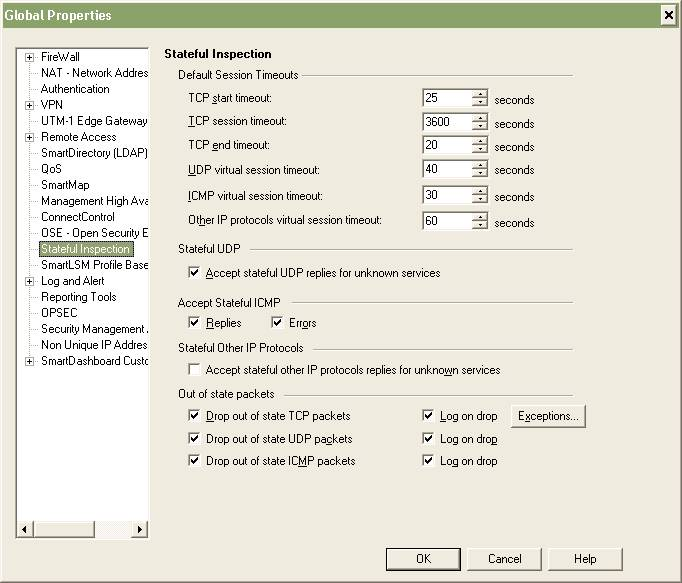
I also took the opportunity to check the TCP timeout value. The TCP timeout is the value that the firewall will use to age out connections in the table if there’s been no activity. This is useful to prevent stale TCP connections from filling your connection table and taking down your firewall. Unfortunately for me I use the same Smart Center environment to manage both my internal and external (Internet) firewalls. This can be a problem since the TCP session timeout value is a global value applied to all firewalls in the Smart Center console. It’s a problem because I have internal firewalls where the TCP session timeout needs to be a fairly large number like 86400 (1 day) and I have external/Internet firewalls where the TCP session timeout needs to be fairly small number like 3600 (1 hour). I haven’t found a workaround to this problem other than making sure I edit the Global Properties policy manually every time I want to push a policy to a specific firewall.
You can find the figure below by selecting Policy -> Global Properties from within Smart Dashboard.
I’m curious what other people use as a value for the maximum number of connections.
The value will obviously be based on the number of devices trying to traverse the firewall, be it internal traffic or Internet traffic. It’s well known that some P2P applications out there can easily create hundreds of connections from a single machine, not to mention all the malware including viruses, trojans, spyware, etc and the number of TCP connections they try to initiate.
Is there anyway for Smart Center to alarm if this value approaches some threshold or limit?
I’m curious what management options there are avialable to have Smart Center alarm or report on the maximum number of connections. I believe the SNMP MIB for Check Point has an OID for the number of active connections but does that mean I need a third party solution to monitor that OID via SNMP like HP OpenView?
Thanks to Steven Drzaszcz for his help via Twitter!
Cheers!

In our environment we have some terrible developers that do not go by standards, So they have bad coding requiring one application to not handle TCP time out very well at all so we need a specific connection to last the longest we can allow in our checkpoint firewalls, while I like to keep the time out low globally.
What can do as I have is create a new TCP service object, same port/range, but specify the TCP time out in the object properties advanced settings overriding the global setting, There are two settings, the session timeout and aggressive aging settings available. Also will need to un-check the “Enable for TCP resource” box if another service about has the same port/range configured already that matches for TCP resource.
Hi Mike,
Thanks for the comment and the information.
Cheers!
Max number of concurrent connections:
This value may vary for each scenario, the best solution is to take a look in the connection table for a while and than change that number to a value that will best fit for your current scenario. You can check the status of the conneciton table by logging into the firewall and running the commands:
fw tab -t connections
You may check the limit value which must be the same that you set in the “Capacity Optimization” thru the GUI.
fw tab -t connections -s
This may show you a summary of the current status of your connection table
TCP Timeout:
If you identified which application is causing trouble you can create a rule for the traffic of that application and create a service object, than you in the properties of that object you can click in the Advanced button and change the timeout value for that service object. The firewall is going to timeout that connection the custom timeout value is reached.
E-mail and alerts:
The values that SmartView Monitor can monitor to send alerts are shown in Tree View > Gateways > Select a Gateway > Thresholds Configuration button
Unfortunately it doesn’t send alerts for the max number of concurrent connections
Thanks for the post Thiago!
If you run snmpd you can poll the following OID to get current connection count –
1.3.6.1.4.1.2620.1.1.25.3.0
Thanks for tip Pete!
what is the OID for this setting- Max Concurrent Connections?
Hi John,
You can examine the SNMP MIB for yourself, you’ll find the Check Point SNMP MIB in my collection of mibs (click on MIBS from menu bar above).
I graph the OID fwNumConn to plot the number of connections over time.
Good Luck!
thank you Mike. I was reading your article about the Maximum Concurrent Connections setting and we would like to compare our Current Connections to the Maximum Concurrent Connections settings in our monitoring. I did look at your MIB and it is no different than the MIB I have in our monitoring tool. I even did a walk on the Checkpoint MIB, but was unable to locate the OID for Maximum Concurrent Connections value of 25000 (still at default per our FW admins). I see fwNumConn and fwPeakNumConn, but the values on these OIDs change over time. So can you help me determine the OID for Maximum Concurrent Connections, if it even exists?
Hi John,
You would get that value from your configuration settings, not from an SNMP OID.
Follow the instruction above to determine what the max value is then configure your monitoring tool to utilize that number as a max value – very easy to-do in MRTG/RRD.
Good Luck!
Michael,
I have this message in a contivity 1750, with firewall licence
“AUG 31 16:42:39 tEvtLgMgr 0 : SNMPTraps [05] 1.3.6.1.4.1.2505.1.3.2 5002 3 Firewall: Max Connection Reached ”
Do you have any idea?
Thanks in advance.
Sergio Serrano.
Hi Sergio,
I would guess that you’ve reached the maximum number of connections for the AVR 1750. That might mean your under a DoS attack, it might mean that you have some virus loose on your network flooding your Internet link.
Cheers!
What we find is that monitoring the fwNumConn does not typically provide any peak that occurred between the polls. We were finding that we must have been hitting the table limit and nothing was reporting that was occurring.. This is very serious and it is hard to imagine that CheckPoint doesn’t provide an alert or a log message indicating this happened.
What we are finding useful is to monitor the fwPeakNumConn, which will hold the maximum number of connections that have occurred since the box was booted.
We have yet to find a guide on how to set the connection table size. We just bumped it from 100,000 to 130,000 and immediately saw that the peak moved to 103,921. This tells me we have probably been having a problem.. which explains a bunch of reports that browsers are hanging, etc., during the daytime when the traffic is high.
I am now monitoring and alerting on the peak connections in our tool — PRTG.
When we had problems the last time, it wasn’t the connection table itself, but it was the NAT table that was filled. That was due to an old setup where it was manually changed. Typically the NAT table takes its size from the setting of the connection table (they are both the same size). There is no OID to check the NAT table, but it can be checked through the CLI:
fw tab -t fwx_alloc -s. I have setup a utility that PRTG calls to obtain the NAT current and peak numbers issuing this command.
Right, there is no OID to show the current settings of either table, but the CLI can return this information:
fw tab -t connections | grep limit
fw tab -t fwx_alloc | grep limit